How Do I Use Debugging Tools to Debug Magic xpi? (Magic xpi 3.x)
When you need to troubleshoot a Magic xpa or Magic xpi engine, a log file may be necessary when the problem is not reproducible by you or by the Tech Support department. This topic explains how to use debugging tools to create dump log files for Magic xpa (uniPaaS) or Magic xpi (iBOLT) when Magic’s Tech Support department asks for them.
You can create 32-bit dumps on 64-bit machines in one of the following ways:
-
Using the Task Manager. It is possible to create a dump from the Task Manager. However, it must be a 32-bit Task Manager.
-
Run the program that you want to troubleshoot.
-
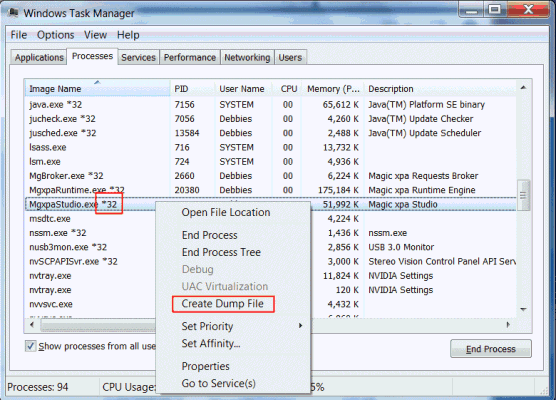
Open the Task Manager from C:\Windows\SysWOW64\taskmgr.exe. This is the 32-bit Task Manager. If you want to verify that you are running the 32-bit version of the Task Manager, you can check that taskmgr.exe is listed with *32 in the Task Manager itself. The *32 next to the process name, which you can see in the image below, indicates that the process is using the 32-bit architecture.
-
Right click on the process that you want to troubleshoot and select the Create Dump File option.
-
Using the ProcDump utility.
-
Download the procdump.exe file from: http://technet.microsoft.com/en-us/sysinternals/dd996900.aspx. It is not necessary to install this – just download and run it.
-
Run it using the following syntax from the command line:
procdump –e –ma [process_name] <full pathname for dump file>
Or
procdump –e –ma <PID> <full pathname for dump file>
-e = wait for an unhandled exception
-ma = dump full file
|

|
To see a video demonstration about using WinDbg to debug Magic, click here.
|
To use the Microsoft Windows debugger (WinDbg), carry out the following on the machine where Magic xpi is installed:
-
Create a new folder called mgdbg on your C drive (note that it must be on C).
-
Download or run a copy of the Debugging Tools for Windows from:
http://www.microsoft.com/en-us/download/confirmation.aspx?id=8279
-
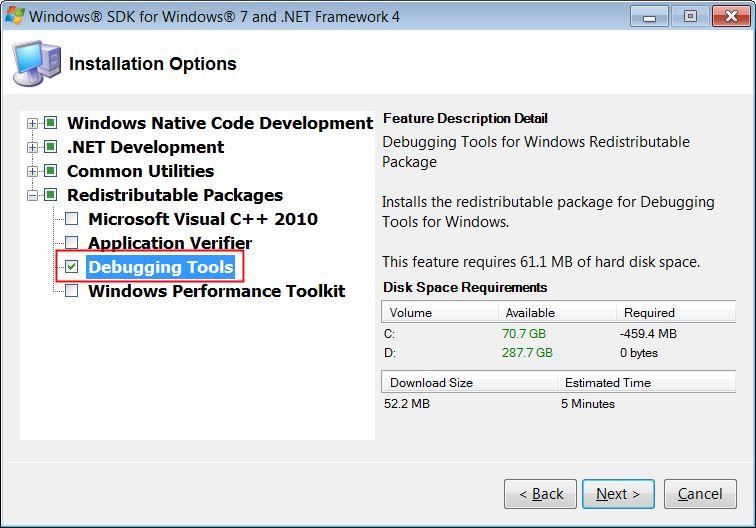
From the Windows SDK Setup Wizard, click the Next buttons until you get to the Installation Options screen, check the Debugging Tools check box and uncheck all of the other options. Click Next twice and when the installation is done, click Finish.
If you already have Windows SDK installed, select the maintenance option to see this screen.
-
If you save it, make sure the C partition on your hard drive has enough free space, since the process creates several files that can be fairly large. Use the links below to download the WinDbg internal configuration file suitable for your version of Magic.
Go to the attachment at the end of this topic to download the file suitable for iBOLT and Magic xpi.
To download the file suitable for Version 9, Version 10, uniPaaS and Magic xpa, go to: Using Debugging Tools to Debug Magic xpa (Magic xpa 3.x).
-
Unzip the file, make sure to rename the file to windbg.in and save it to the c:\mgdbg folder.
-
Open the CMD windows as Administrator.
-
Use the following syntax in the CMD window:
[Full pathname of windbg.exe executable] -p [process id] -G -Q -c "$<c:\mgdbg\windbg.in"

The [process id] is the process ID of the Magic Runtime, which you can find in the Processes tab of the Windows Task Manager.
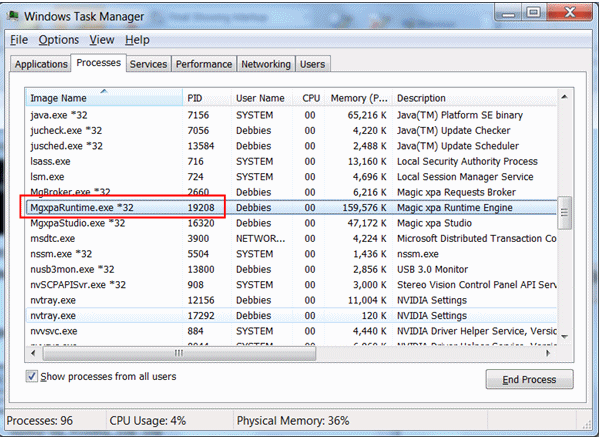
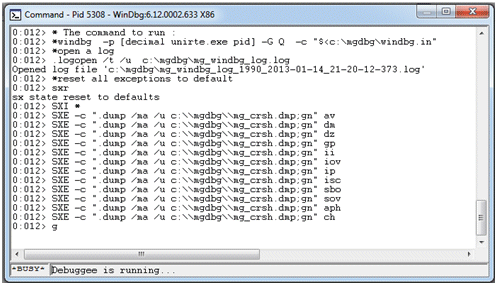
The debugger window opens.
-
Run the Magic application that you want to troubleshoot.
-
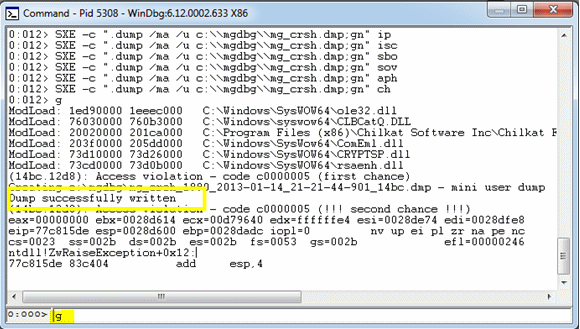
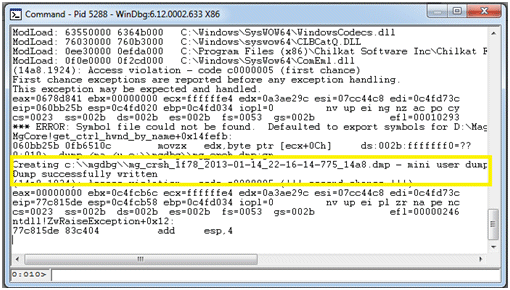
Once the engine crashes, you should see the words Dump successfully written as shown in the screen below. This creates the dump files in the folder that you created earlier. In this case, the mgdbg folder on the C drive.
-
If you run only one Magic xpi engine on the machine you can also use the following syntax:
[Full pathname of windbg.exe executable] -pn [.exe name] -G -Q -c "$<c:\mgdbg\windbg.in"

The .exe name is as follows:
mgrntw.exe for version 9
eDevRTE.exe for version 10
uniRTE.exe for uniPaaS
MgxpaRuntime.exe for Magic xpi
iBoltServer.exe for iBOLT versions
MgxpiServer.exe for Magic xpi versions
You can also trap crashes of the development environment by changing the .exe name/Process ID.
|
Important:
|
To debug a multi-threaded Magic engine, you have to make sure that a crash of one thread crashes the entire Runtime engine in order to produce a dump file. This is done by using the Magic.ini file definition:
[MAGIC_SPECIALS]
ExceptionMessageBoxDisplay = Y
|
If you don’t have access permissions to the command line, you can create a dump file by going directly to the WinDbg tool as follows:
-
Run the WinDbg utility (as Administrator) before loading the application: Start->All Programs-> Debugging Tools for Windows-> WinDbg.
-
From the File menu, select the Attach to a Process option to attach the Magic engine.
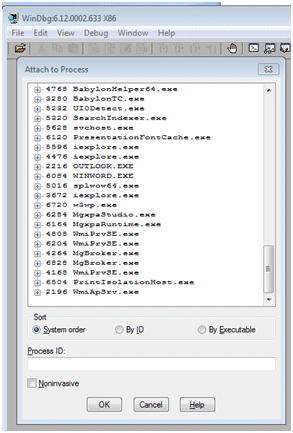
Note: You can sort the process by executable name so that it will be alphabetized.
-
Make sure that the .exe that you want to debug is running.
-
From the process list select the .exe file that you want to debug or type the process ID and click OK.
-
Once again, open up the application that you want to troubleshoot and run it.
-
Once the .exe file crashes, type the command $<c:\mgdbg\windbg.in and press Enter. This will load the script in mgdbg.in and will create the dump file.
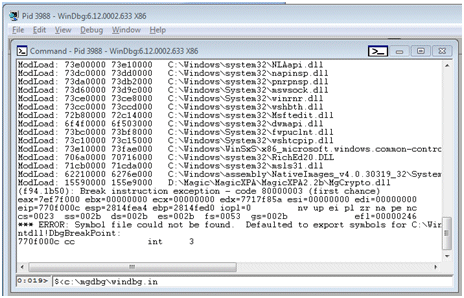
There are scenarios in which the Runtime engine crashes on startup, making it impossible to attach the Windows debugger to an existing process.
In this case, in the WinDbg tool:
-
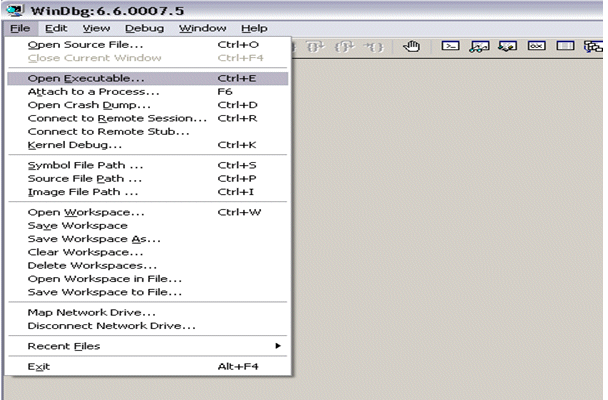
From the File menu, select the Open Executable option to load the Magic engine:
-
Select your Runtime .exe file and open it.
-
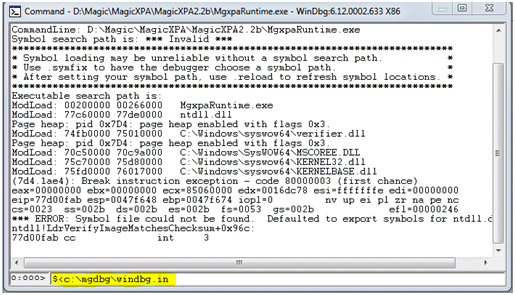
Once the .exe file loads, type the command $<c:\mgdbg\windbg.in
This will load the script in mgdbg.in.
Note: If you already ran the tool once, you can also type in the letter g and then Enter without having to type in the path.
-
Click Enter to enable debugging.
-
Run the application until the moment of crashing. You’ll see the words Dump successfully written and the dump files are created in the mgdb folder.
If there is no crash:
-
Open the windbg.in file.
-
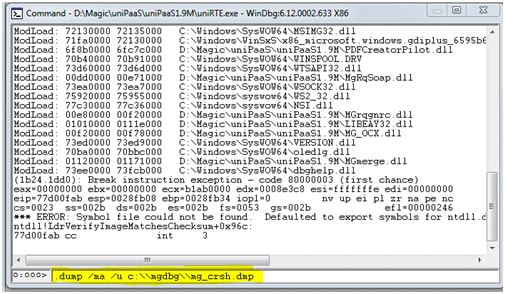
Copy the line that starts with the word .dump. For example: .dump /ma /u c:\\mgdbg\\mg_crsh.dmp;gn.
-
Paste it at the bottom of the Command screen and press Enter.
There are scenarios in which a dump file will not hold the required information necessary to understand the cause of the crash. For that reason, you will be asked to generate a dump file that holds Global flags (gflags) information. To configure the Debugging Tools for Windows to generate the extra information, perform the following steps (Note: Make sure that you run the .exe file only after setting the global flags.):
-
Run the Global Flags utility from: Start->All Programs-> Debugging Tools for Windows-> Global Flags.
-
Click Yes.
-
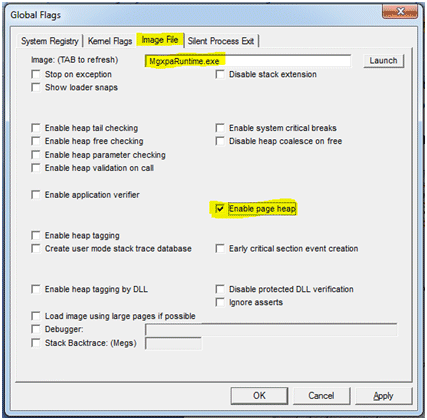
Place the focus on the third tab called Image File.
-
Type in the name of the .exe file you want to debug. Make sure that you do not use a full path, but the image name only (as shown below).
-
Press the Tab button to enable the options on the screen.
-
Select the Enable page heap check box, and any other check boxes that Tech Support asked you to select.
|
Important:
|
Make sure that you remove the definition of the Global Flags once the dump file is generated so that there is not unnecessary consumption of the memory. Do this by opening the tool again and clearing the Enable page heap check box.
|
Sometimes it is difficult to capture a user dump inside a terminal session because WinDbg doesn’t work as the default debugger. In such cases, the following procedure can be used to create the dump files.
This procedure will create a dump file automatically for any crash of any application.
This procedure requires registry changes. Do not use it unless there is no other choice.
-
Install the latest Debugging Tools for Windows: http://www.microsoft.com/whdc/devtools/debugging/default.mspx.
-
Set WinDbg as the default debugger by issuing the following command: WinDbg –I
Note: The I must be capitalized.
-
Create a folder where the dump must be stored and give it full control permissions for users or remote desktop users.
For this example, the c:\TEMP folder is used.
-
Find the following key and add the string described below if it is not already there:
HKEY_LOCAL_MACHINE\SOFTWARE\Microsoft\Windows NT\CurrentVersion\AeDebug
For example, it has the following value:
"C:\Program Files\Debugging Tools for Windows\windbg.exe" -p %ld -e %ld –g
Take the current key value and append the following string:
-c '.dump /o /f c:\TEMP\new.dmp; q' -Q -QS -QY –QSY
The new key should have the following value:
"C:\Program Files\Debugging Tools for Windows\windbg.exe" -p %ld -e %ld -g -c '.dump /o /f c:\TEMP\new.dmp; q' -Q -QS -QY –QSY
On 64-bit Windows, use the 64-bit Debugging Tools for Windows. However, if you want to save dumps from 32-bit processes (shown as *32 in the Task Manager) you also need to change the Wow6432Node registry hive and use the 32-bit WinDbg.exe file from the 32-bit Debugging Tools for Windows:
HKEY_LOCAL_MACHINE\SOFTWARE\Wow6432Node\Microsoft\Windows NT\CurrentVersion\AeDebug
Whenever there is an exception inside a session, a dump is stored in the temp folder.
Note: The previously stored dump is overwritten.
-
On some operating systems such as Windows Server 2003, Windows XP and later you can use the /ma switch instead of /f to save additional debugging information, such as handle data and thread time information:
"C:\Program Files\Debugging Tools for Windows\windbg.exe" -p %ld -e %ld -g -c '.dump /o /ma c:\TEMP\new.dmp; q' -Q -QS -QY -QSY
-
If the dump is still not generated, try to enable detailed process tracking in your local security policy. Then, look for process creation events in the security event log to see if the post-mortem debugger is launched.
Note: This procedure will create a dump file for any crash on the machine and override the existing file in the c:\TEMP folder.
-
Click Start and Run.
-
Type RegEdit to open the Registry Editor.
-
Expand HKEY_LOCAL_MACHINE and go to Software. Click Microsoft, WindowsNT, Current Version and AeDebug.
-
Double-click the registry key named Debugger on the right-window pane.
-
Change the entry to "drwtsn32 -p %ld -e %ld -g" – including the quotation marks – to change the post-mortem debugger back to its default.
-
Click OK and close the Registry Editor.
Using the User-Mode Dump Heap (UMDH) to Debug Magic

