How Do I Monitor Running Threads in Magic xpi Projects? (Magic xpi 3.x)
You can use the Magic Broker to monitor the threads that are running on a Magic xpi Server. When you start a Magic xpi project, a Magic xpi Server is started and connected to the Broker. The Broker manages the Magic xpi Server's requests.
When installing Magic xpi, you can choose to install the Magic Broker as either an executable or as a system service. When the broker is installed as an executable, a Magic Broker icon appears in your system tray. Here, you can view the Magic xpi Server’s active threads.
When the Broker is installed as a system service, the icon does not appear by default, but can be activated (see instructions below). With either installation option, you can use a command line executable to monitor the running threads.
It is also possible to view this information through the Magic xpi monitor when using the Multi Project view.
If you installed the Magic Broker as an executable when you installed Magic xpi, the Magic Broker icon appears in your system tray. You can use that icon to open the Magic Broker screen.
Each line represents a running Magic xpi application. For each project, the Broker gives you the following information:
-
ProcessID: The project’s Process ID.
-
Status: The project’s status. For example, Idle or Busy.
-
Current Threads: The current number of threads being used by the project.
-
Peak Threads: The highest number of threads the project has used at any time since startup.
-
Max Threads: The maximum number of threads the process can use.
|
Note:
|
If a maximum number of threads was set for the project, that number is displayed. Otherwise, the Max Threads values are the maximum allowed threads according to your Magic xpi Server's license.
|
|
-
Current Contexts: Current active Magic xpi contexts.
-
Requests Served: The number of requests served by the project.
-
Application: The name of the running project.
If you want to view the information from the command line executable, open a command line window, change to the Magic xpi installation directory and type mgrqcmdl.exe –QUERY=RT.
The output is the same information that is displayed by the Broker window. You can see the server name (including its IP address), Process ID, Status, and all thread information under the Threads column. This column is divided into Current Peak Max, Current Contexts, and Requests Served.
When you use the Magic xpi Monitor in the multi-project mode, you can see the running thread information in the Projects View. Each running project has a green light next to its name, and the relevant thread information is displayed, as seen in the following illustration:

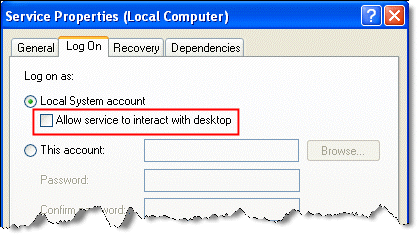
If you installed the Magic Broker as a service, the system tray icon does not appear by default. You can activate the icon by going to the Services Management Console and selecting your Magic xpi Broker service. The service name is the name chosen during Magic xpi's installation. Choose the Log On tab, and make sure the Allow service to interact with desktop box is checked.

After doing this, you should restart the service. Then, the Magic Broker icon should appear in the system tray.

