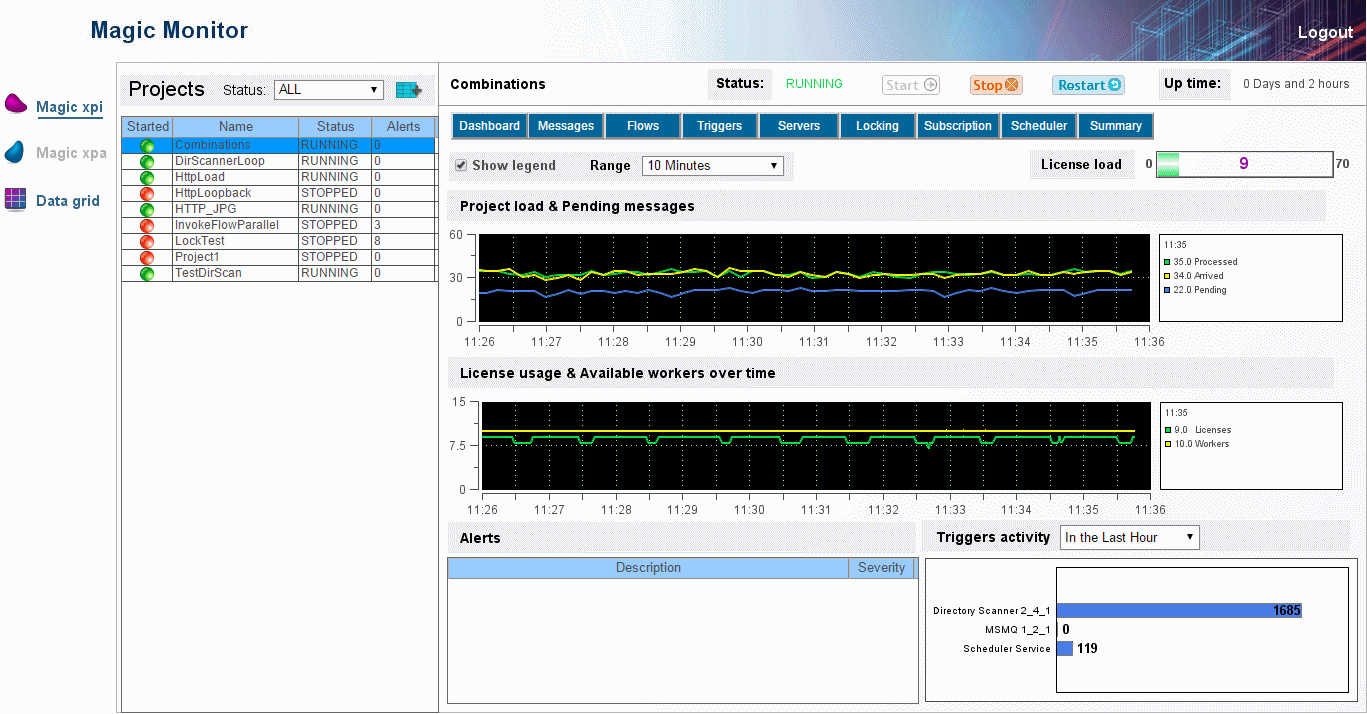
Magic xpi Projects Dashboard Tab (Magic xpi 4.1)
When you click on one of the Actions links in the Magic xpi Dashboard, the Magic xpi Projects Dashboard opens.

The Magic xpi Projects Dashboard consists of two main areas.
In the collapsed Projects pane, on the left of the dashboard, you can select one of the following options from the Status drop-down list to further refine the information that is displayed:
When you make your selection, you will see information about the project's name and status, and the number of alerts that have been reported for this project.
Click  to open the expanded Projects pane. This pane shows additional information about the project, including the number of messages served by the project, the length of time that the project has been running for, and the number of engines and workers being used by the project. There are also further details about the number of license threads allocated to the project, and the number of license threads that the project is currently using. Here, you can click the Stop All button to stop all the currently running projects.
The detailed Project View pane consists of an upper toolbar and a larger information pane.
The upper toolbar displays the name of the project, its status, and the time it was started. There are also Start, Stop, and Restart buttons for controlling the project. Note that these buttons are not available if you log in as a guest.
The larger information pane is controlled by a series of tab buttons that let you select the specific information that you want to view. Apart from the Dashboard button, which takes you back to the Magic xpi Projects Dashboard from the other windows, these navigation buttons are Messages, Flows, Triggers, Servers, Locking, Subscription, Scheduler, and Summary.
The Magic xpi Projects Dashboard displays detailed information about your Magic xpi project. You can filter this information by selecting the Show Legend check box, and you can adjust the time span of the displayed information using the Range drop-down list. The License Load displays the current number of consumed license threads.
The detailed project breakdown in this window includes:
-
Project load and pending messages: Displays the number of messages that entered the Space in the last minute, the number of messages that left the Space in the last minute, and the number of messages whose status is READY_FOR_USE and IN_PROCESS that exist at the end of the sample interval.)
-
License usage and available workers over time: Displays the project’s license usage and the total number of workers that are available for the project.
-
Alerts: Displays any alerts that occur in the project, their severity level, and the reported date and time that they occurred.
-
Triggers activity: Displays the number of triggers that are operating in your project. You can filter this information using the drop-down list.

