How Do I Monitor Broker Activity? (Magic xpa 3.x)

When using the Broker, you may need to get statistics on the broker load. Magic xpa has several tools for monitoring broker activity.
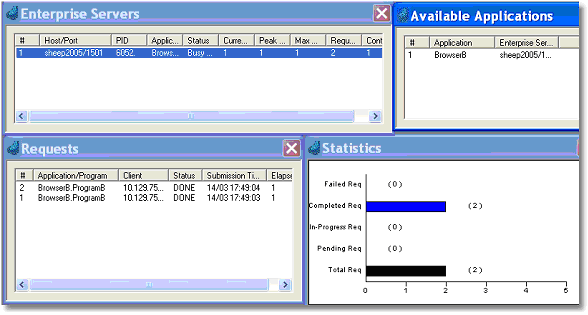
The Broker Monitor, shown above, provides a visual, real-time display of what the Broker is doing.
|

|
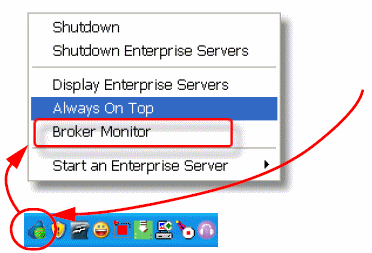
You can bring up the Broker Monitor by clicking on Broker Monitor from the right-click menu of the Broker icon in the Windows Task bar.
|
|
The information shown on the Monitor is also available using the built-in Magic xpa RQ functions. For instance, RqContexts returns information about the context. RqLoad returns the total number of requests, and the number of requests that are pending, in progress, successfully executed, and that failed execution.
In addition to returning information about the Broker, some of these functions also allow you to control certain Broker operations. For instance, RqRtBlock will block requests going to a particular server or service.
Many of these functions require the use of a password -- either a Supervisor password or a Query password -- which is set up in the mgrb.ini file (see How Do I Define the Broker Password?).
The mgrqcmdl.exe utility allows you to fetch information about the Broker externally to Magic xpa. For instance,
mgrqcmdl -query app
lists all the applications supported by the current Enterprise server.
To get a list of all the options, open a command prompt window, navigate to the engine directory and enter the command line option with no parameters:
mgrqcmdl
|

|

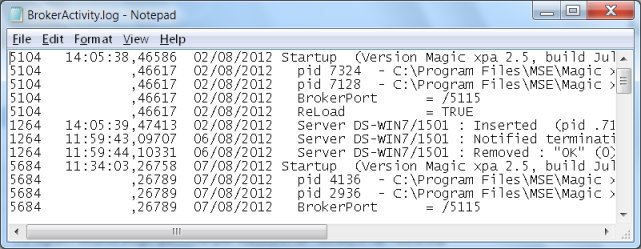
You can also get information from the BrokerActivity.log. This log is by default located in the Magic xpa installation directory.

