How Do I Debug MSMQ Applications? (Magic xpa 3.x)
Because messaging can involve multiple applications and servers, debugging an MSMQ might be more involved than a Magic xpa-only application. However, you have some good tools for debugging MSMQ at your disposal.
-
The Debugger (see How Do I Debug My Application Using the Debugger?) is very useful to see what is going on internally.
-
MSMQ errors are written to a log file. The location and name of that log file are set in the logical name MessagingErrorLogFile. By default it is set to %MessagingComponentDir%MG_message_err.log.
-
You can view the MSMQ messages from within Windows. We’ll cover this below.

-
Start->Control Panel->Administrative Tools->Computer Management
-
Open the tree node Services and Applications.
-
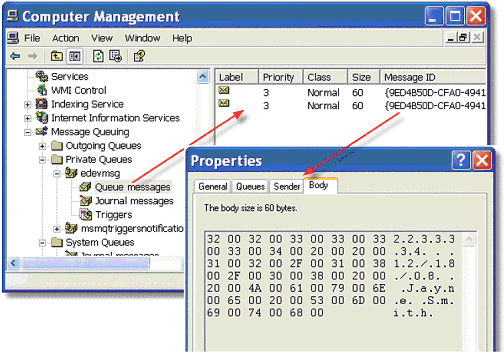
Open Message Queueing. Now you will see the message queues you have available.
-
Go to the queue you are writing to. In the Queue messages section, you will see the messages that haven’t been read off the queue yet.
-
Now, for any one message, you can use Properties from the right-click menu to view the internals of the message. You can see the message body, as shown here, and also other properties of the message.
Note: You may have to select Action->Refresh from the overhead menu to get new messages to display while the Computer Management window is open.

